As recognized by the UN, UNEP, OECD, IUCN, ISO, and other organizations (emphasis added):


The world is facing a triple planetary crisis of climate change, nature and biodiversity loss, and pollution and waste.

tree icon elephant icon fish icon kelp icon atmosphere insect icon ocean icon wetlands icon monkey icon soil icon

This open-source information site, And Biodiversity, serves as a resource to study the other crisis which often runs silent, invisible, and in the background to the general public. But all three environmental emergencies share important interlinkages and common drivers of human activities.

For any explanation, citation, or justification regarding biodiversity loss, bookmark this site and return to review and share the topic, reports, figures, quotes, and resources.


In our silent and invisible background, biodiversity and ecosystems provides essential services through Nature’s Contribution to People:


Regulation of Environmental Processes

IPBES Nature's Contribution to People #1 IPBES Nature's Contribution to People #2 IPBES Nature's Contribution to People #3 IPBES Nature's Contribution to People #4 IPBES Nature's Contribution to People #5
IPBES Nature's Contribution to People #6 IPBES Nature's Contribution to People #7 IPBES Nature's Contribution to People #8 IPBES Nature's Contribution to People #9 IPBES Nature's Contribution to People #10


Materials and Assistance

IPBES Nature's Contribution to People #11 IPBES Nature's Contribution to People #12 IPBES Nature's Contribution to People #13 IPBES Nature's Contribution to People #14


Non-Material and Other

IPBES Nature's Contribution to People #15 IPBES Nature's Contribution to People #16 IPBES Nature's Contribution to People #17 IPBES Nature's Contribution to People #18


Source: IPBES 2019 Global Assessment (Fig. 1)


But human activities are rapidly degrading biodiversity and ecosystems at an unprecedented level through five key direct drivers:


IPBES Direct Driver of Nature's Change 1
IPBES Direct Driver of Nature's Change 2
IPBES Direct Driver of Nature's Change 3
IPBES Direct Driver of Nature's Change 4
IPBES Direct Driver of Nature's Change 5


Source: IPBES 2019 Global Assessment (Vimeo video)


To resolve biodiversity loss, environment considerations must be mainstreamed across domains:


Academia

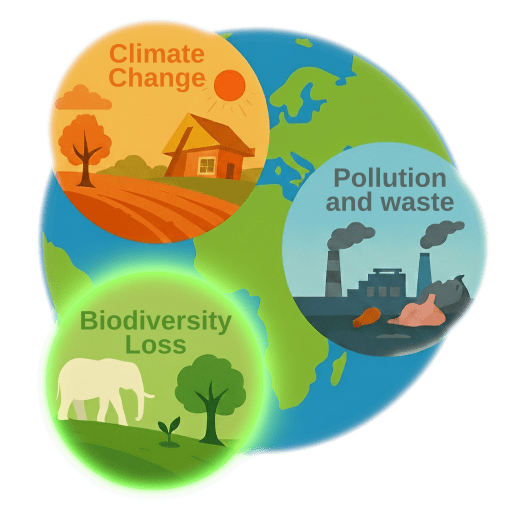
Interdisciplinary Curriculum

stick figure diagram

Integrating biodiversity modules into non-biological degrees such as Economics, Civil Engineering, and Law.

Campus Living Labs

stick figure diagram

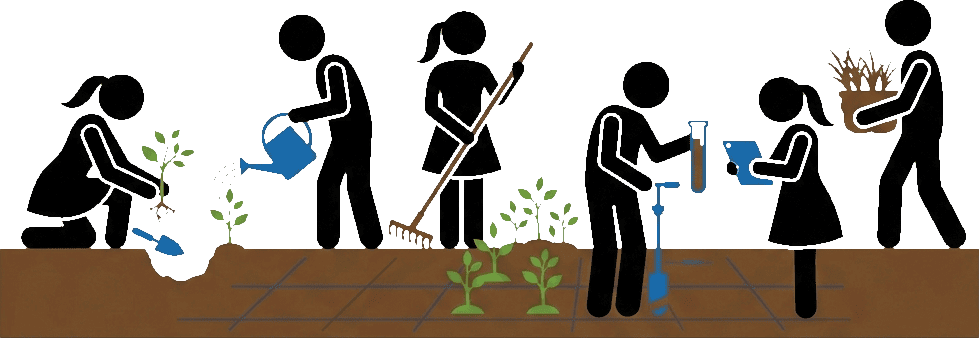
Managing university grounds as active restoration sites for real-world biodiversity recovery studies.

Open-Access Data Repositories

stick figure diagram

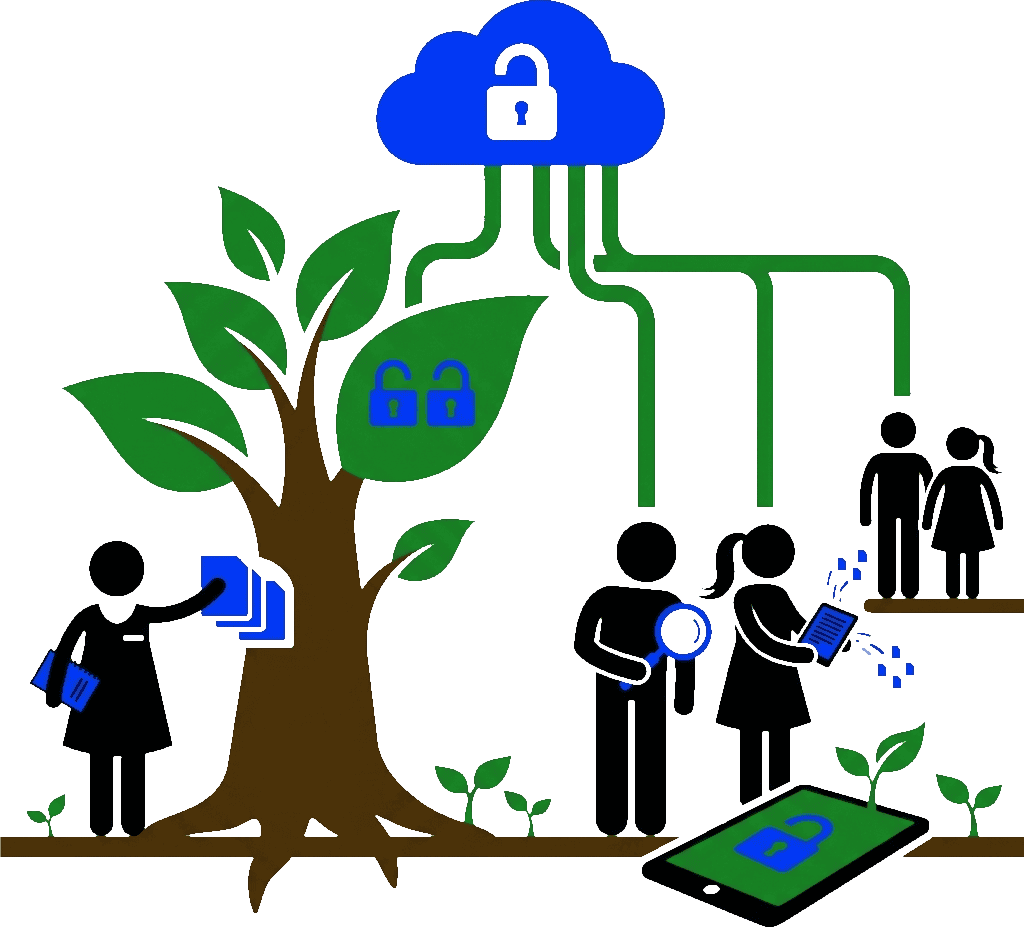
Ensuring all biodiversity-related research and data are freely available to policymakers and the public.

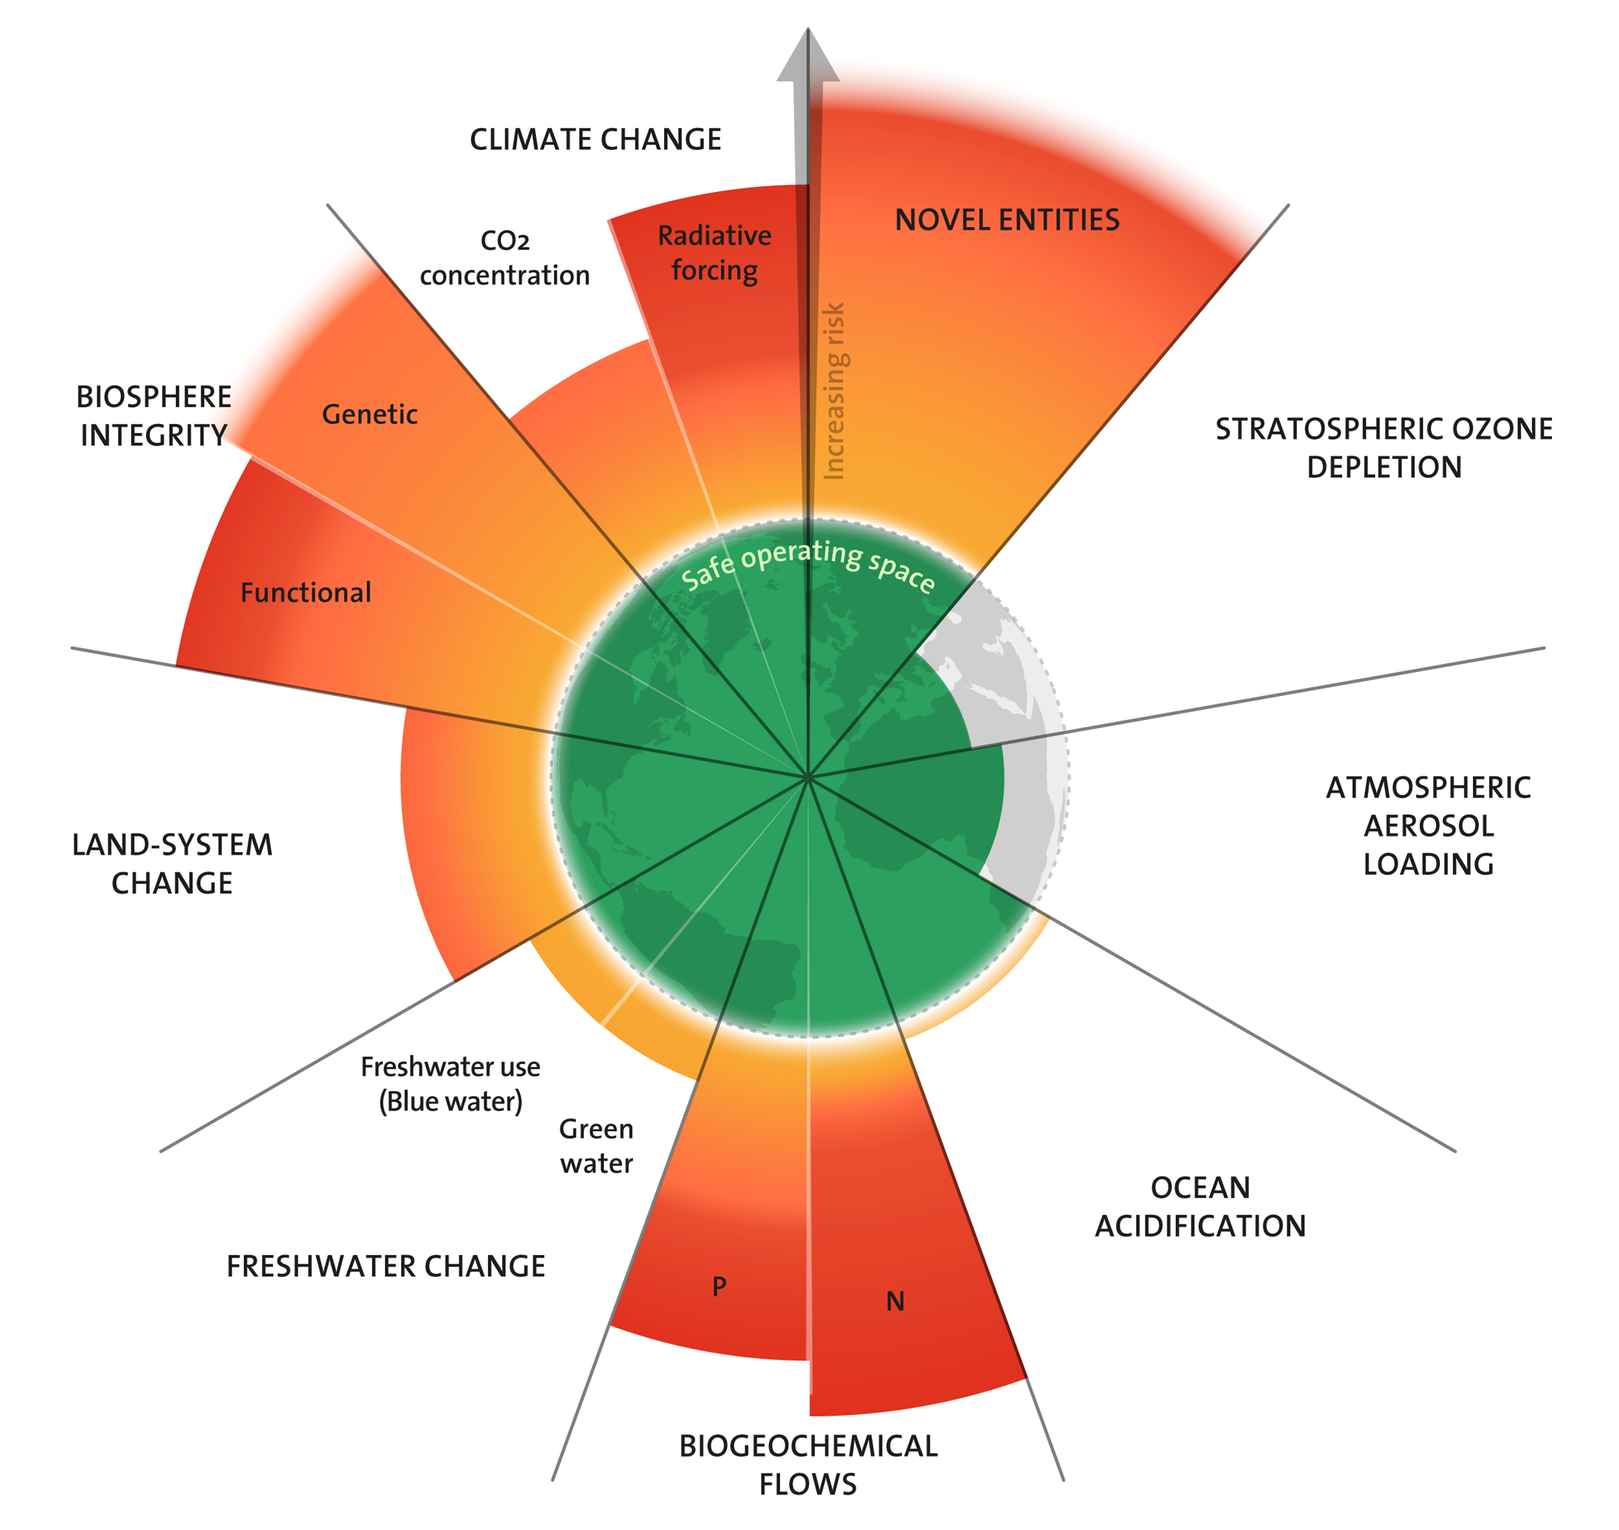
The Nexus Research Focus

stick figure diagram

Prioritizing studies that examine the intersection of climate change, pollution, and biodiversity loss.

Public Science Communication

stick figure diagram

Training scientists to translate complex ecological data into actionable narratives for the public.


Business and Industry

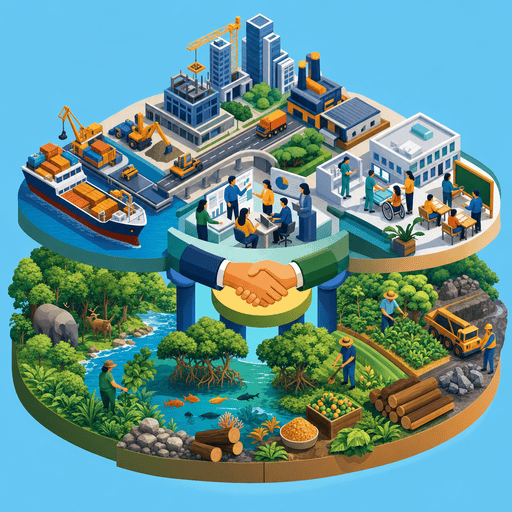
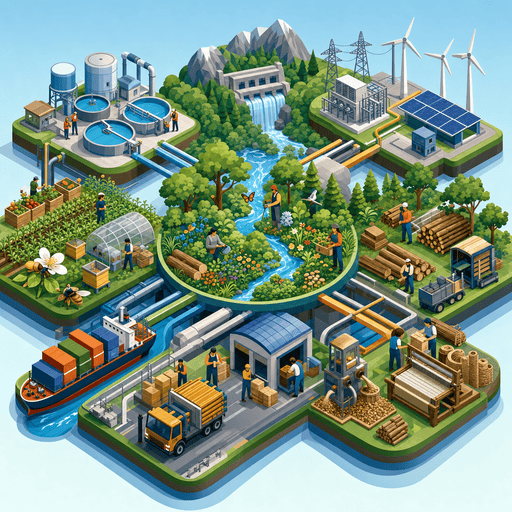
Circular Economy Transition

stick figure diagram

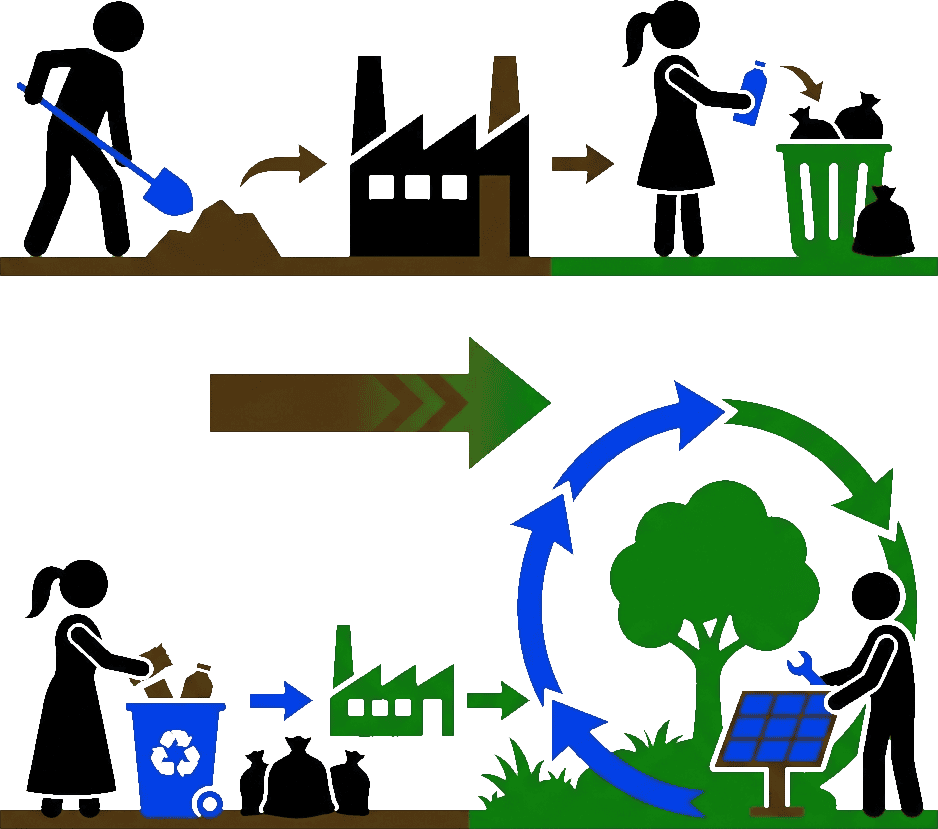
Moving away from take-make-waste models to reduce demand for raw materials and habitat destruction.

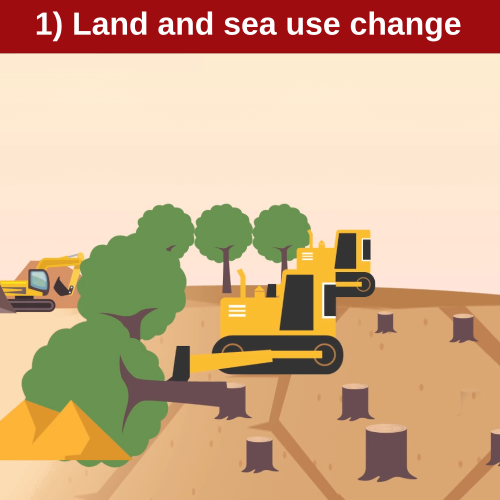
Zero-Deforestation Supply Chains

stick figure diagram

Implementing rigorous tracking to ensure supply chains do not contribute to the clearing of primary forests.

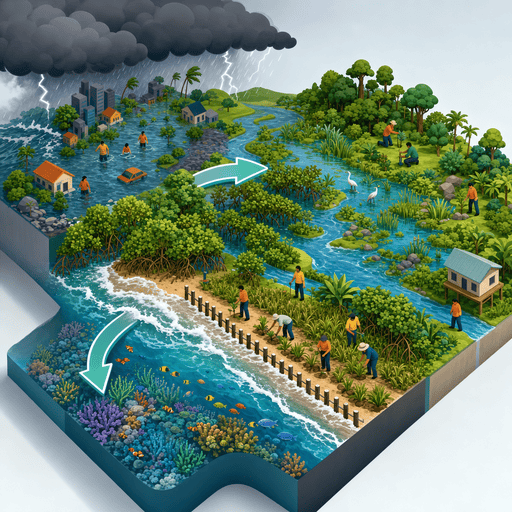
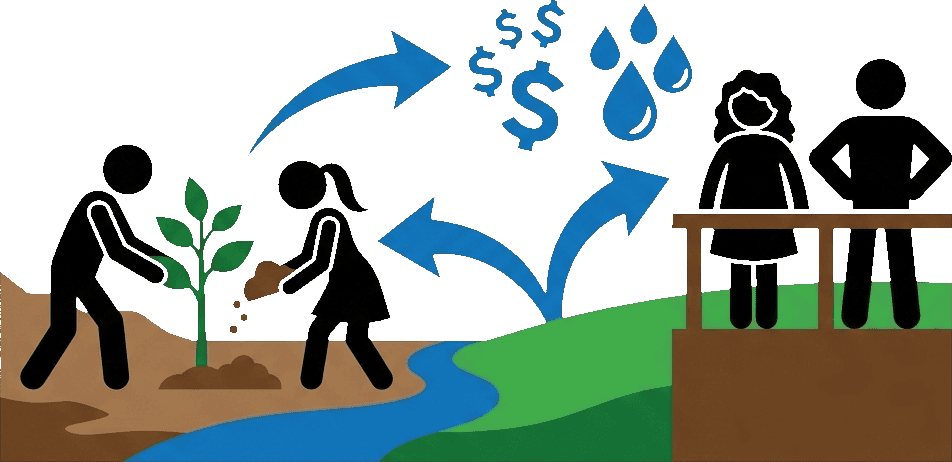
Nature-Based Solutions (NbS)

stick figure diagram

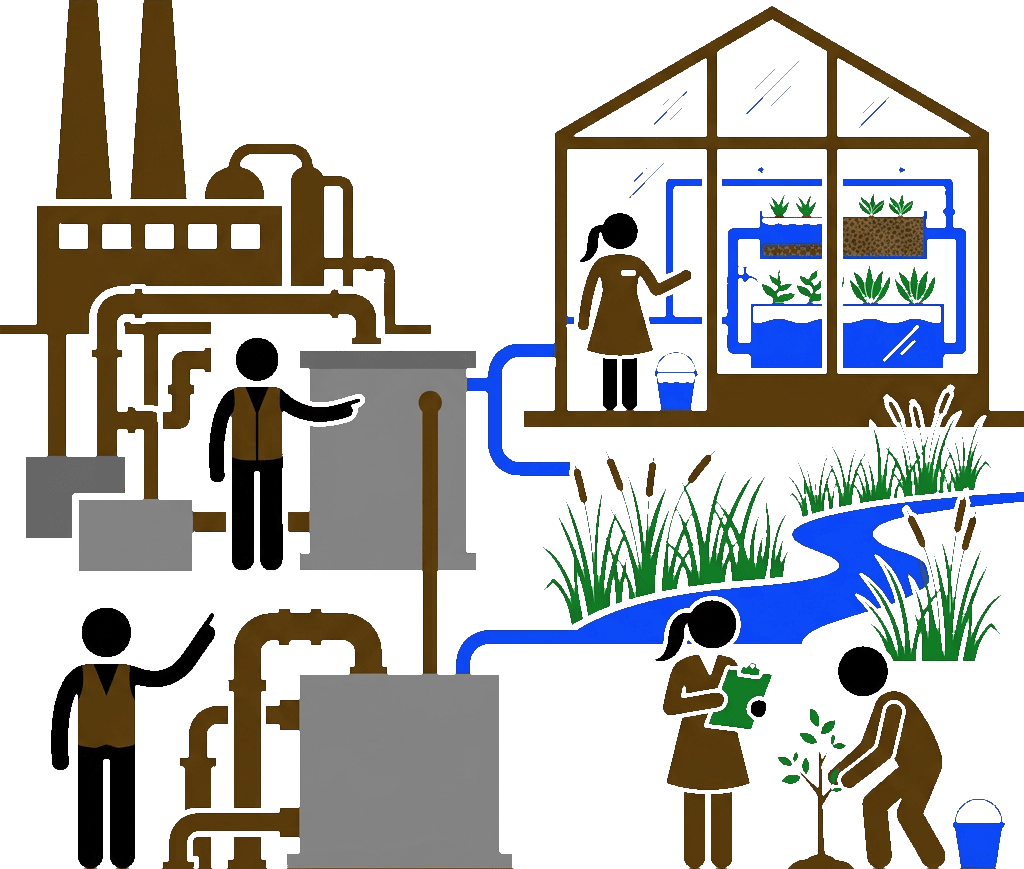
Investing in natural systems like wetlands for water purification rather than traditional grey infrastructure.

Internal R&D for Alternatives

stick figure diagram

Developing new materials, such as biodegradable polymers, to reduce pressure on natural ecosystems.

Biodiversity KPIs

stick figure diagram

Including biodiversity health metrics in annual reports to hold executives accountable for nature-related outcomes.


Civil Society

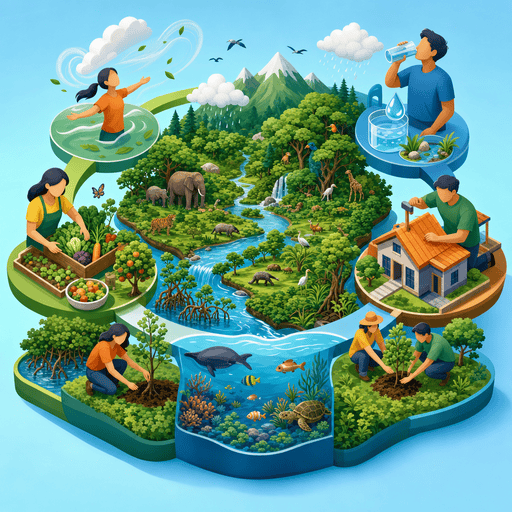
Citizen Science Participation

stick figure diagram

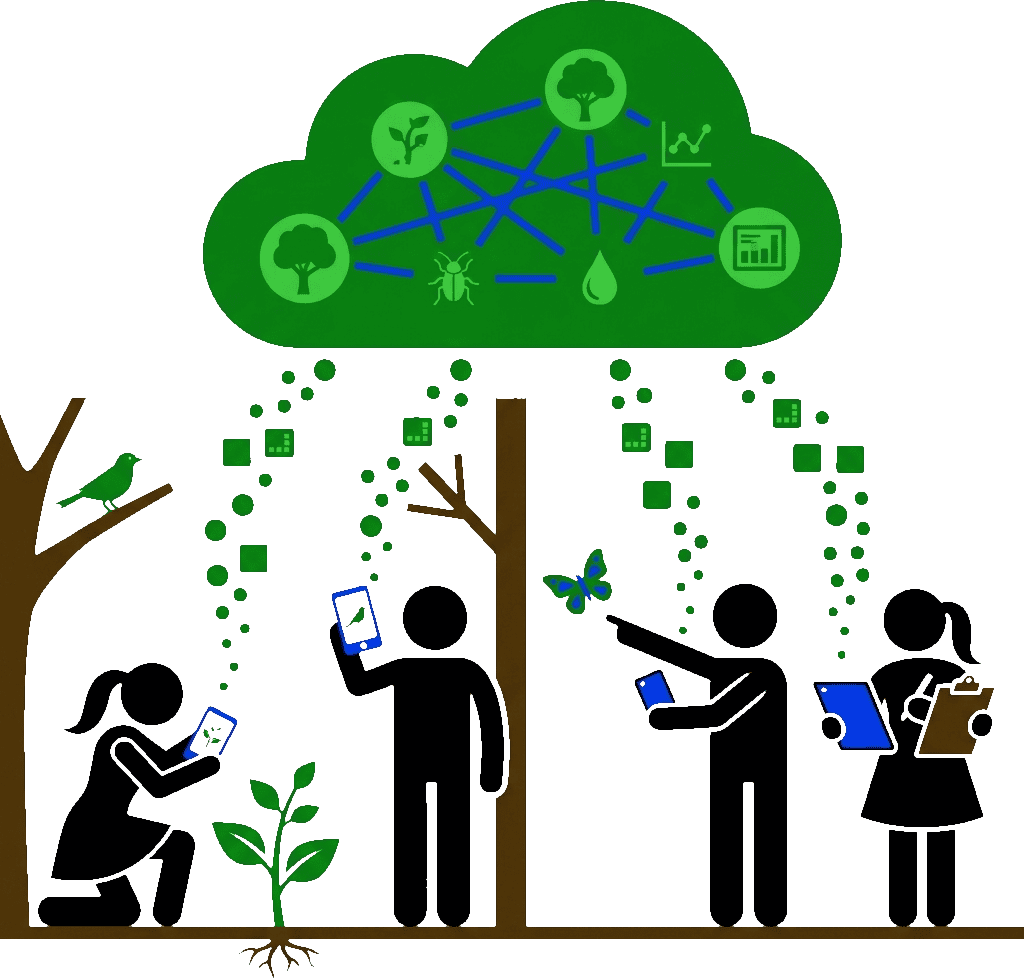
Utilizing mobile apps and community platforms to engage the public in tracking local species and contributing to ecological datasets.

Rewilding Private Spaces

stick figure diagram

Transforming traditional lawns and balconies into micro-habitats using native plants to support local pollinators.

Nature-Label Awareness

stick figure diagram

Supporting third-party verified biodiversity-friendly labels on consumer goods to drive market demand.

Community-Led Land Trusts

stick figure diagram

Creating local organizations that purchase or manage land specifically for biodiversity restoration.
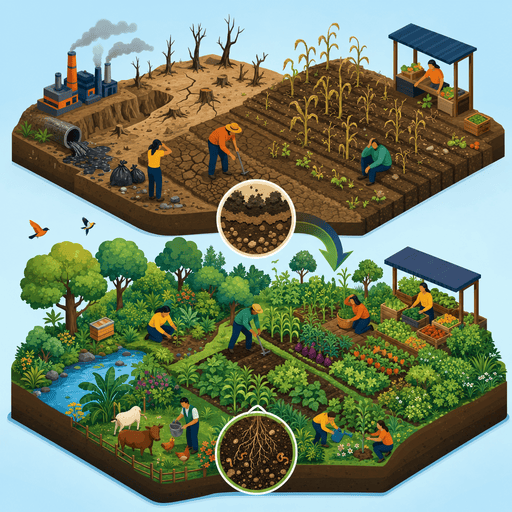
Dietary Shifts

stick figure diagram

Promoting a shift toward diverse, locally adapted food sources that require less land and chemical input.


Governments

Subsidy Reform

stick figure diagram

Redirecting financial support from harmful agricultural, fishing, and extractive practices toward regenerative and nature-positive activities.

Natural Capital Accounting (NCA)

stick figure diagram

Integrating biodiversity and ecosystem services into national accounts to reflect the true wealth of a nation’s natural assets beyond GDP.

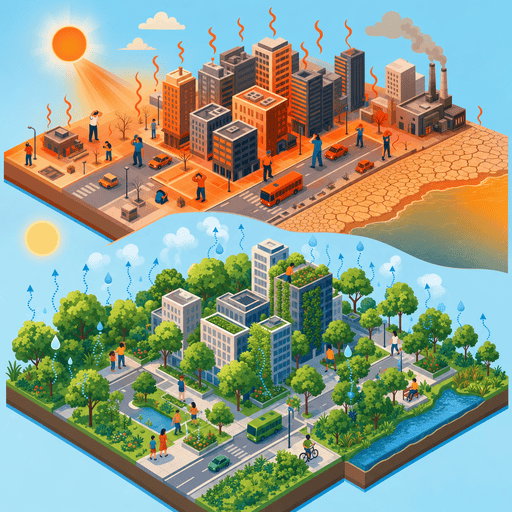
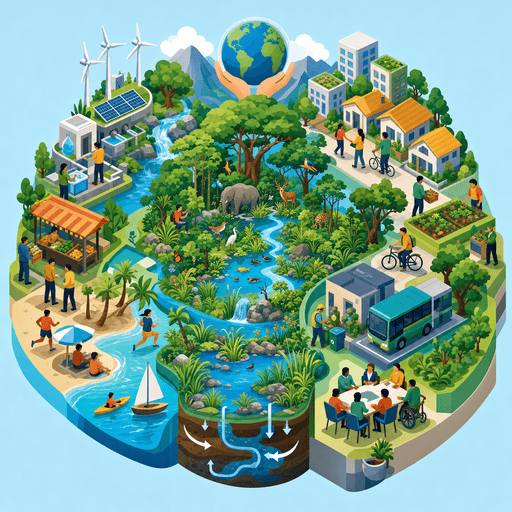
Urban Green Infrastructure

stick figure diagram

Mandating nature-inclusive urban planning, such as wildlife corridors, green roofs, and permeable surfaces in all new developments.

Public Procurement Standards

stick figure diagram

Requiring that all government-sourced materials meet strict zero-deforestation and high-biodiversity-standard certifications.

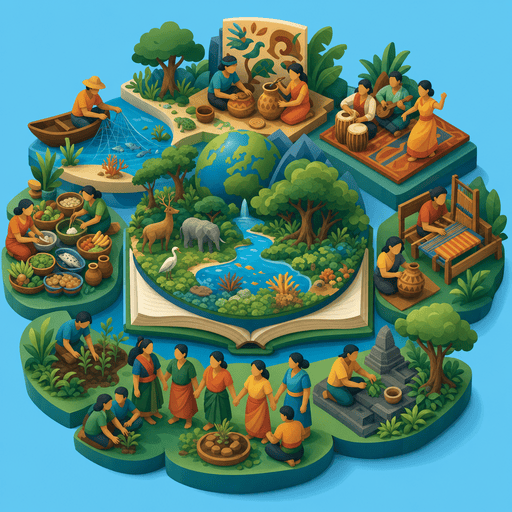
National Education Curricula

stick figure diagram

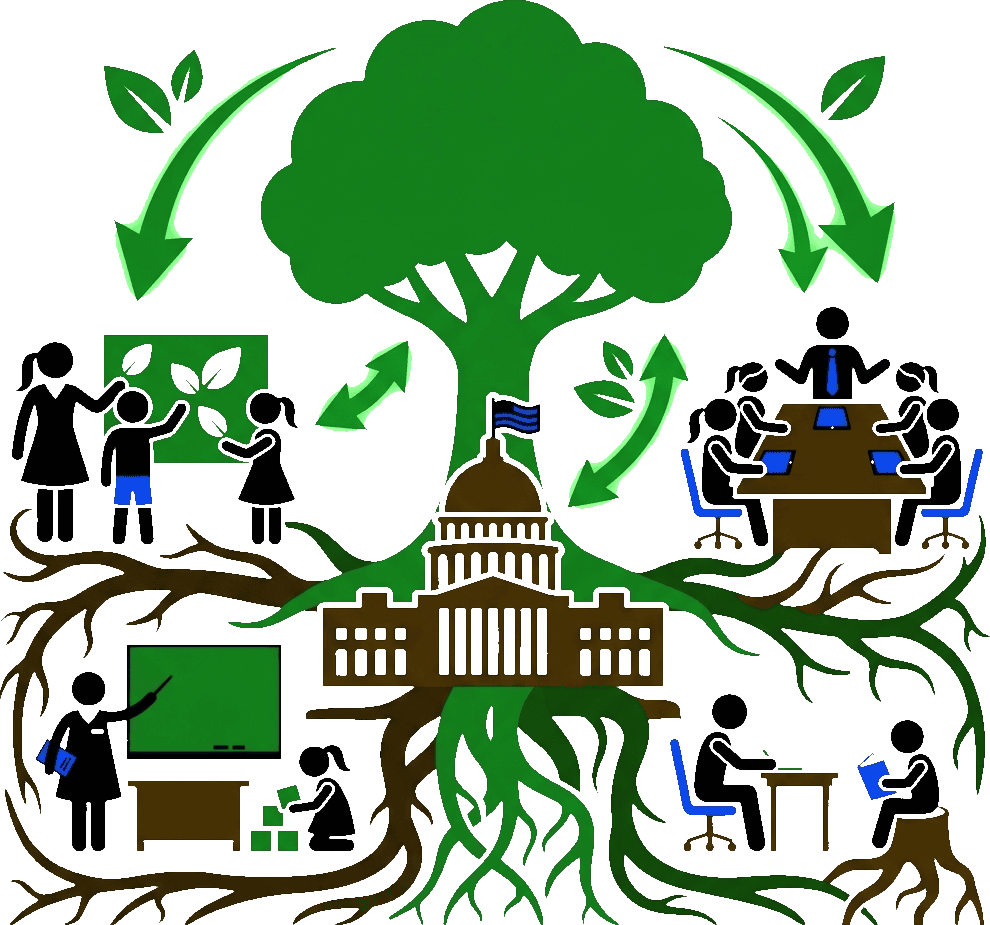
Embedding ecological literacy into primary and secondary education as a core competency.


Nongovernmental and Multilateral Organizations

Debt-for-Nature Swaps

stick figure diagram

Facilitating agreements where a portion of a nation’s foreign debt is forgiven in exchange for local investments in conservation.

Harmonized Monitoring Protocols

stick figure diagram

Developing global standards for biodiversity data to ensure transparency and comparability across borders.

Transboundary Conservation Areas

stick figure diagram

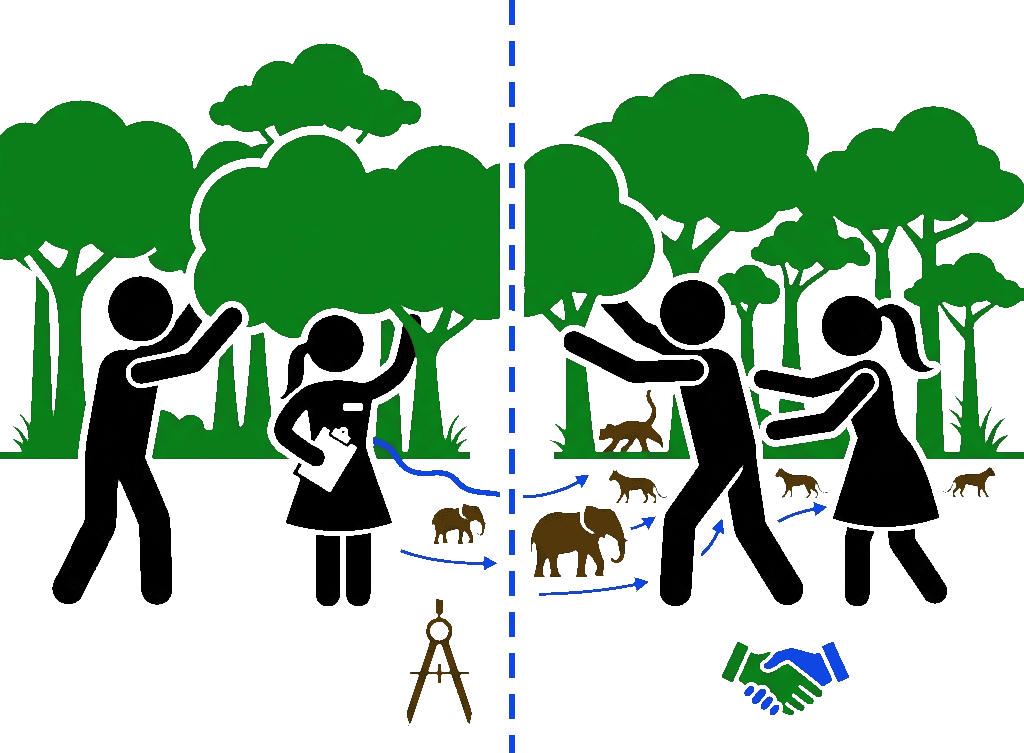
Coordinating the management of ecosystems that span national borders to ensure ecological connectivity.

The Nature-Positive Benchmark

stick figure diagram

Establishing science-based targets for international trade and aid that require a net gain for biodiversity.

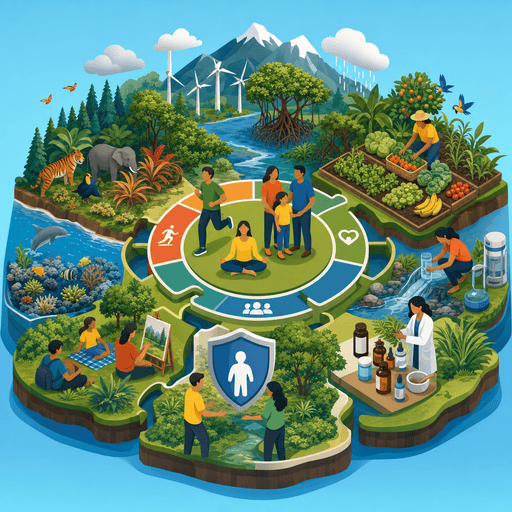
Mainstreaming in SDGs

stick figure diagram

Ensuring biodiversity conservation is treated as a foundational prerequisite for achieving all UN Sustainable Development Goals.


Nonprofits

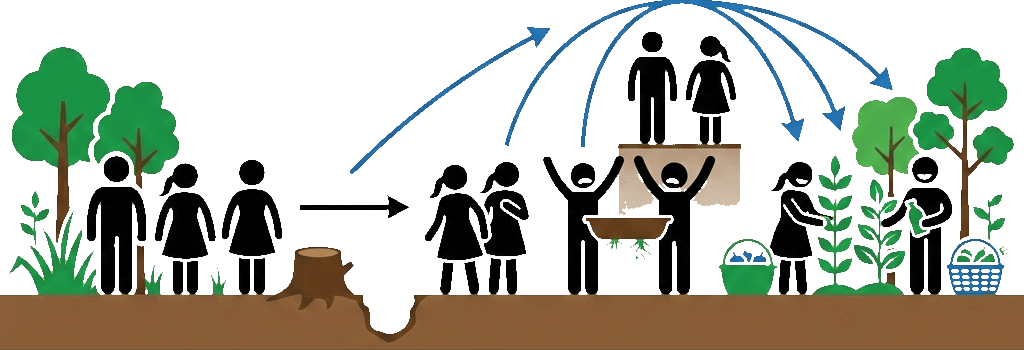
High-Impact Restoration Projects

stick figure diagram

Executing large-scale projects that demonstrate the economic and social benefits of healthy ecosystems.

Corporate-NGO Partnerships

stick figure diagram

Providing technical expertise to help corporations map footprints and implement restoration strategies.

Flagship Species Campaigns

stick figure diagram

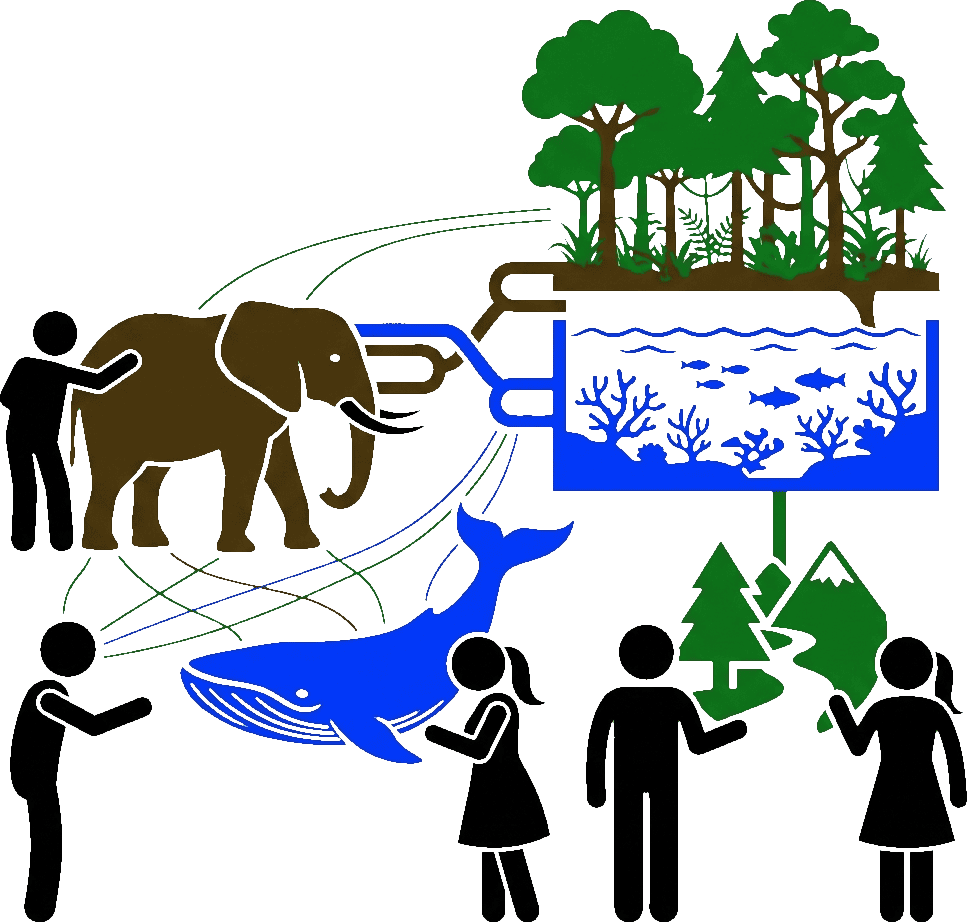
Using charismatic local species as ambassadors to connect people emotionally to broader ecosystem health.

Local Biodiversity Toolkits

stick figure diagram

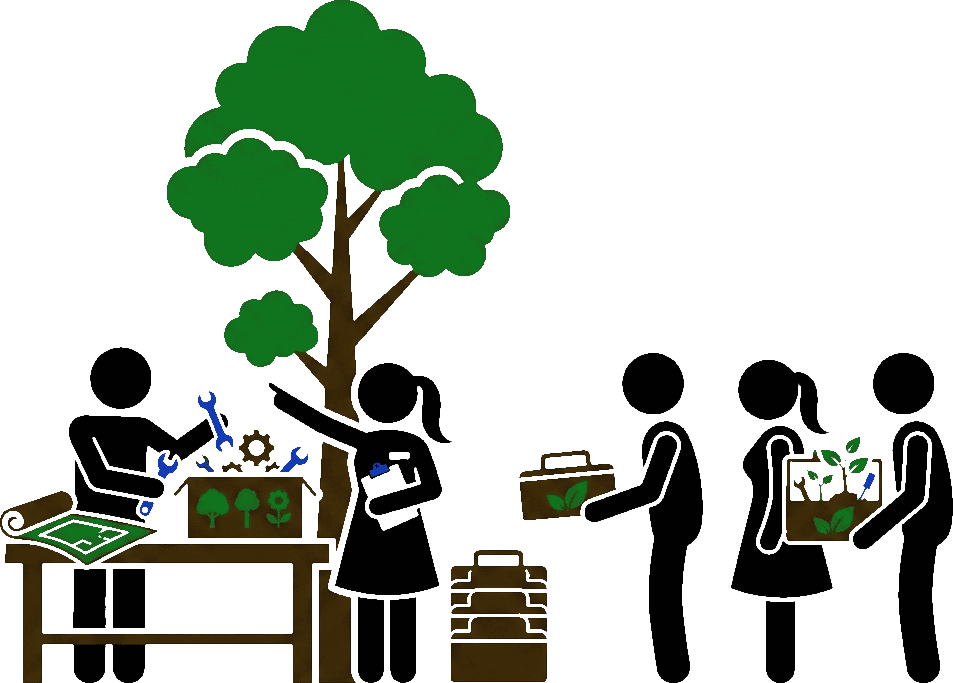
Developing accessible guides for small-to-medium enterprises to integrate nature-positive steps.

Policy Advocacy

stick figure diagram

Mobilizing public support to lobby for stronger environmental protections at local and regional levels.


Professional Organizations

Biodiversity in Accounting

stick figure diagram

Adopting standards for Nature-related Financial Disclosures (TNFD) to track professional impacts on nature.

Certification for Architects and Engineers

stick figure diagram

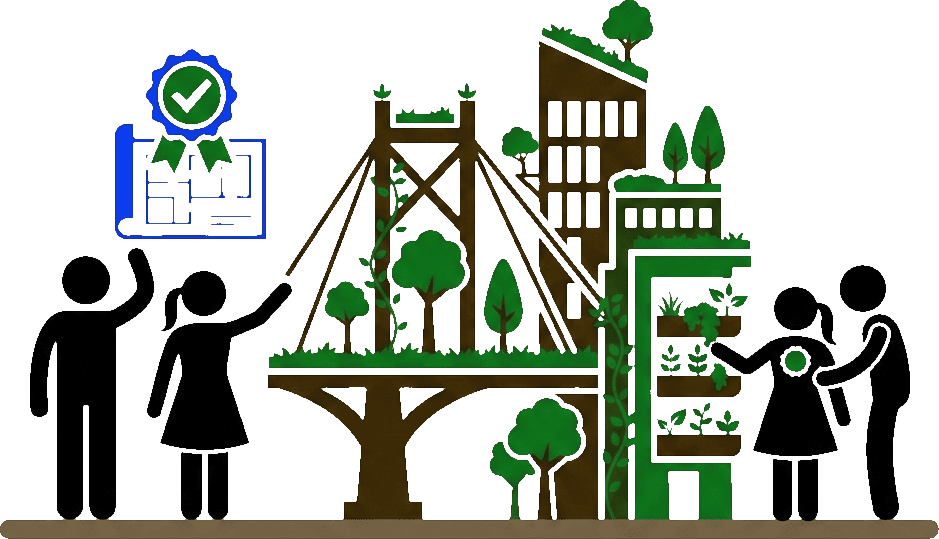
Creating professional designations for experts specializing in biomimicry and nature-inclusive infrastructure.

Legal Rights of Nature

stick figure diagram

Advocating for the recognition of ecosystems as legal entities with standing in court.

Continuing Professional Development (CPD)

stick figure diagram

Requiring annual training on ecosystem services for professionals in finance, real estate, and manufacturing.

Ethical Codes of Conduct

stick figure diagram

Updating professional oaths to include a commitment to preventing the irreversible loss of species.


With its underlying drivers of land/sea use, climate, and pollution, biodiversity loss intersects with the other planetary boundaries that have transgressed safe operating limits in the Earth System:


Planetary Boundaries Framework 2025


Source: Azote for Stockholm Resilience Centre, based on analysis in Sakschewski and Caesar et al. 2025 | CC BY-NC-ND 3.0 | Planetary Boundary Framework (2025)


But nature-based solutions (NbS) can simultaneously solve biodiversity loss and other environmental crises:


Heatwaves

heatwave icon

Climate change causes prolonged and intense heatwaves, and biodiversity with transpiration of trees and plants can bring a coolness and reduce urban heat island effects.


Flooding

flooding icon

Climate change causes more extreme weather events, and biodiversity with healthy rivers, wetlands, and coral reefs across coastlines and floodplains can absorb and buffer storm surges and flooding.


Soil erosion

crops icon

Land degradation and soil pollution cause more crop yields to decline, and biodiversity with rich vegetative cover can regulate and regenerate soil health and stabilize food supply with diverse crops and livestock.


Drought

low water icon

Land use changes and climate change cause more widespread droughts, and biodiversity with healthy freshwater and vegetative cover can regulate water quality, flow, supply, and enhance groundwater systems.


Pests

pests icon

Global trade and changing ecosystems cause spread of invasive pests and diseases, and biodiversity with native and diverse species in place of non-native, monocultures can mitigate prevalence of such pests and diseases.


Wildfires

wildfire icon

High temperature and dry conditions increase fire seasons and wildfires, and biodiversity with diverse forests in genes and species can spread risk, increase resistance to stresses, and promote resilience to forest systems.


Emissions

factory icon

Industries and agriculture contribute to air pollution and carbon emissions, and biodiversity with healthy forests, wetlands, mangroves, seagrass, and other biomes can naturally capture and sequester carbon and toxic particulates.


Why And Biodiversity? To underscore its importance in many human contexts:


Economy

economy icon

Modern economies often measure the accumulation of produced capital (roads, machines, buildings, factories, and ports) and human capital (health and education) but overlook natural capital and biodiversity provides such value with raw materials, resources, and regulation of environment that support commerce and livelihoods.


Society

society icon

A society free from conflict, inequality, and uncertainty requires a stable climate and healthy ecosystems for basic amenities, occupations, and recreation, and biodiversity supports such requirements through functioning carbon, nitrogen, and water cycles and habitat maintenance.


Culture

culture icon

Since the dawn of human civilization, species and ecosystems have been integral in human cultures including languages, arts, foods, customs, beliefs, and values and biodiversity (akin to human diversity) serves as this living library and heritage.


Health

hospital icon

Physical, mental, and social health and well-being require a stable climate and healthy ecosystems and biodiversity serves these needs with air, water, and food quality; medicinal supply; hazard and disease protection; recreation and inspiration.


Infrastructure

water tower icon

Robust critical infrastructure of water, energy, food, and commodity supply requires vital inputs and biodiversity provides water flow and quantity; food pollination and seed dispersal; and natural resources for fiber, fuel, and timber.


Survival

survival icon

Essential human survival needs of air, water, food, and shelter requires a stable climate and healthy ecosystems and biodiversity provides such habital existence for humans and many other species.


Why And Biodiversity? To dispel common misunderstandings:


Although the media and general public overlook biodiversity loss for various reasons, scientists have consistently asserted the devastating consequences of continued loss of biodiversity which is accelerating at unprecedented levels in human history.


Such loss negatively impacts ecosystem services such as life-critical needs of food production, soil formation, water availability, air quality, climate regulation, medicines, and still others. See Reports discussing this crisis over the last 50 years.

Owing to its popularity over the years, climate change has become synonymous with all environment or green issues and therefore encompasses all ecological crises. In reality, climate change is only one issue under the umbrella of nature crises.


In fact, climate is just one of several planetary boundaries of the Earth System which includes biodiversity, ozone, freshwater, land use, nitrogen and phosophorus cycle, chemicals, and others. See Figures for other diagrams of planetary boundaries.

Though the issue lacks mainstream media attention, biodiversity loss has been an enduring subject matter in the ecological and environment science literature since the 1970s. It is widely accepted and well-established with enough impetus to establish a UN convention in 1992 for global initiatives on the issue and intergovernmental science body in 2012 to assess the current knowledge on the topic for policymakers.


See Reports that includes three global assessments across the decades (1995, 2005, and 2019) each with stark findings of rapid biodiversity loss due to human activities.

While the two crises share mutually reinforcing and overlapping causes and effects, the scientific evidence over decades demonstrates both crises are distinct issues and should not be conflated without acknowledgment of their unique and shared qualities.


Consequently, the approach to solve one may negatively or positively affect the other. See Figures that show graphics of overlap, trade-offs, and synergies between the two planetary emergencies.

While species extinctions and ecosystem shifts are natural processes on Earth including five known mass extinction events, the present situation of biodiversity loss exceeds the natural occurrence in geological timescales. Also, unlike past events, the current rapid loss of biodiversity and ecosystems is mostly due to a single species aware of their actions.


See Quotes which includes the finding from IPBES’s 2019 Global Assessment: the rate of extinction is ten to hundreds of times higher than the average background rate in the last 10 million years and is accelerating.

Biodiversity coverage in the media has been a challenge for decades and in turn causes a lack of awareness among the general public. Studies (IIED (2008), Veríssimo, et. al (2014), Legagneux, et al. (2018), and Bradshaw, et al. (2021)) have discussed the under-reported media coverage and messaging of biodiversity loss. As an unfortunate result, only experts tend to know about this planetary crisis.


Even Sir Robert Watson, who either chaired or co-chaired all three global biodiversity assessments acknowledge in a The Guardian op-ed how much biodiversity has been ignored despite its severity and critical importance.


Why And Biodiversity? To mitigate the next mass extinction event:


Ordovician
Extinction

440 million
years ago

Due to glaciation causing habitat loss and later global warming
85% loss of mostly marine plant and animal species

donut chart

Devonian
Extinction

365 million
years ago

Due to loss of oxygen and global cooling causing habitat loss
75% loss of mostly marine plant and animal species

donut chart

Permian
Extinction

252 million
years ago

Due to volcanic activity causing global warming
95% loss of
marine and land, plant and animal species

donut chart

Triassic
Extinction

201 million
years ago

Due to volcanic activity causing global warming
80% loss of
marine and land, plant and animal species

donut chart

Cretaceous
Extinction

66 million
years ago

Due to asteroid impact causing atmospheric debris
75% loss of
marine and land, plant and animal species

donut chart

Holocene
Extinction

12,000 years ago
to Present

Due to human activities causing habitat loss and climate change
??% loss of
wild and domestic species

donut chart


Sources: National Geographic Mass Extinctions Infographic and Britannica Mass Extinction Event


Why And Biodiversity? To help stop:


tree icon

Logging

elephant icon

Poaching

fish icon

Overfishing

kelp icon

Dredging

atmosphere icon

Emitting

insect icon

Spraying

ocean icon

Dumping

wetlands icon

Draining

monkey icon

Encroaching

soil icon

Degrading